1. Navigate to the Patient's chart in order to begin working with Vitals
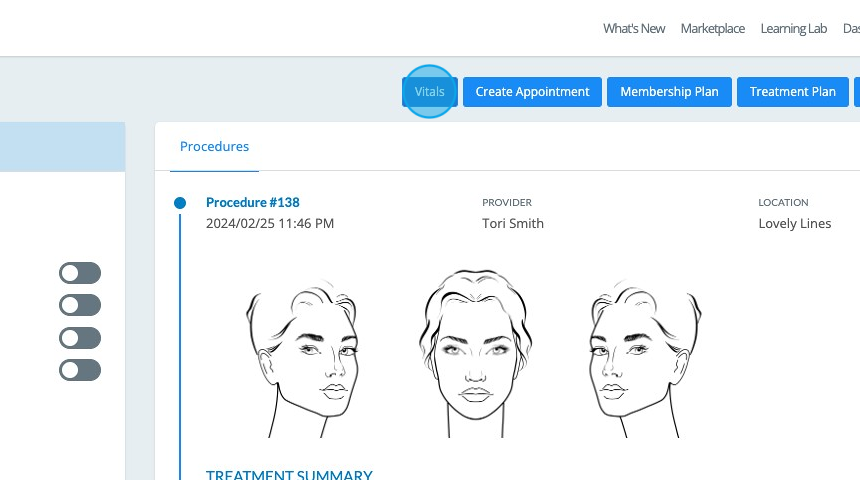
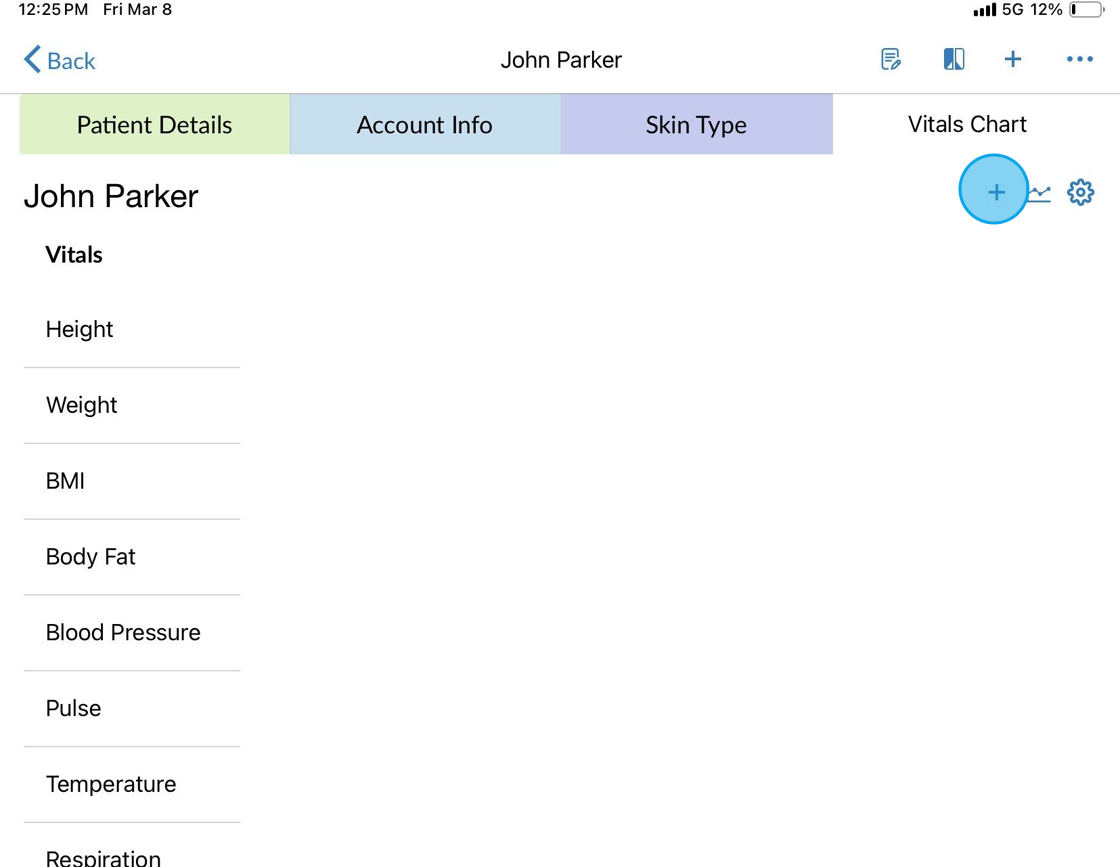
2. Web View: Click Vitals
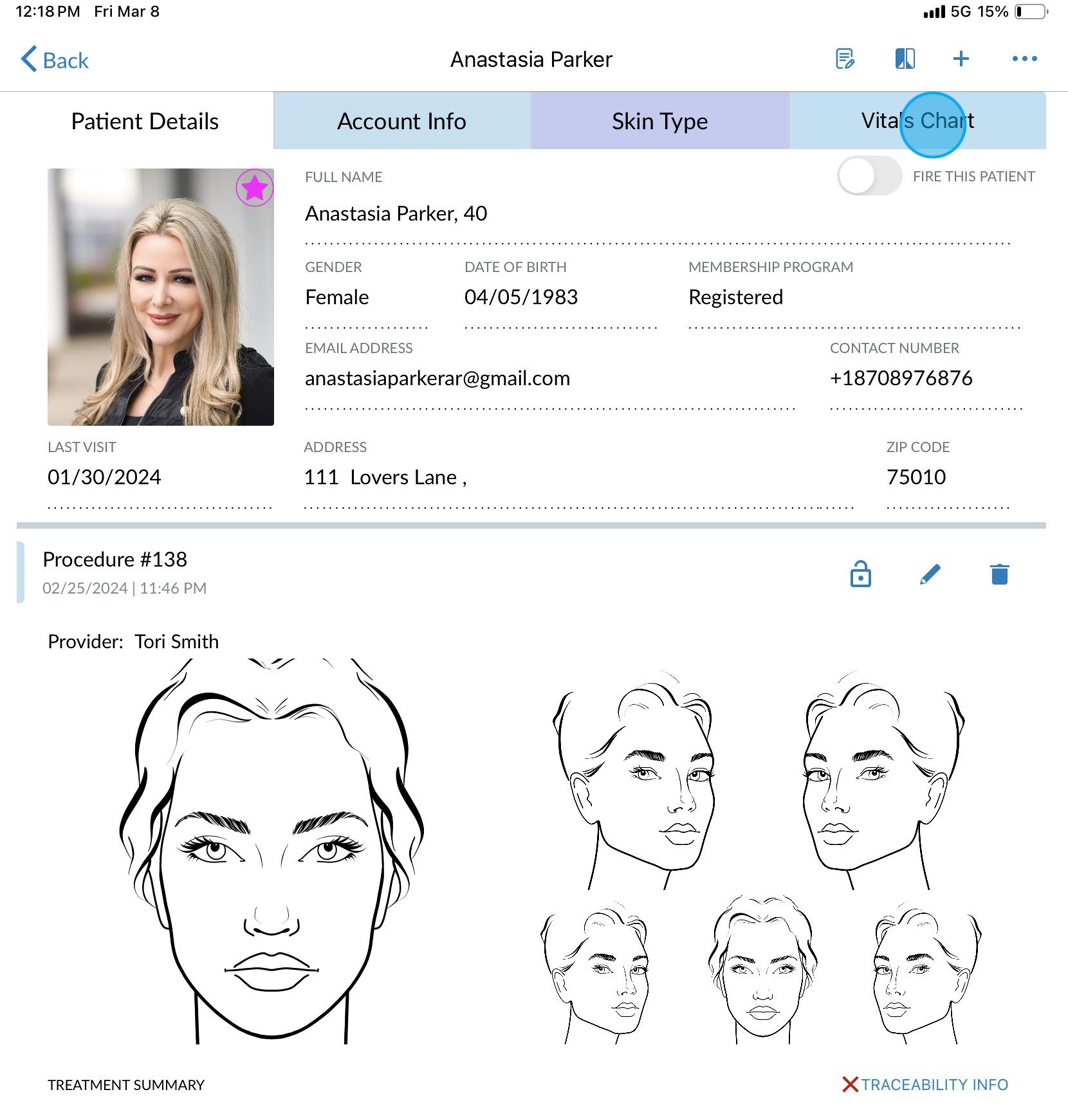
3. iPad App: Click Vitals
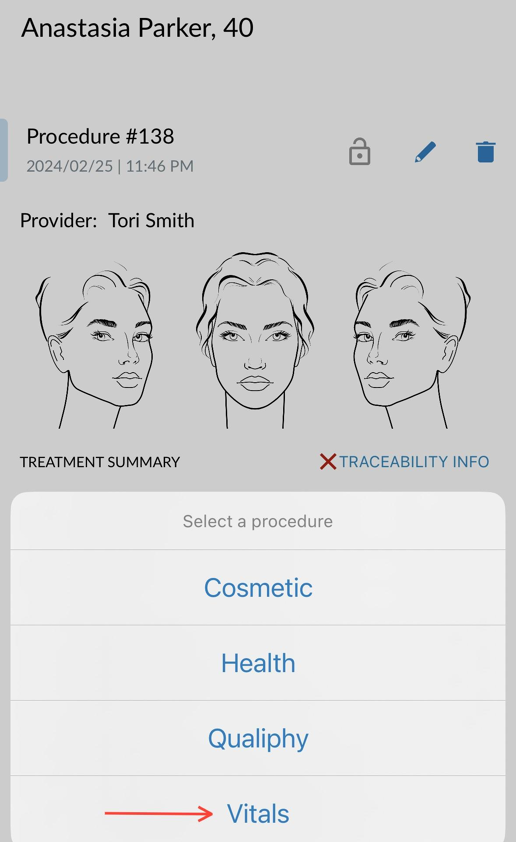
4. iPhone App: Click on the + button as if you were going to create a new procedure, and select Vitals

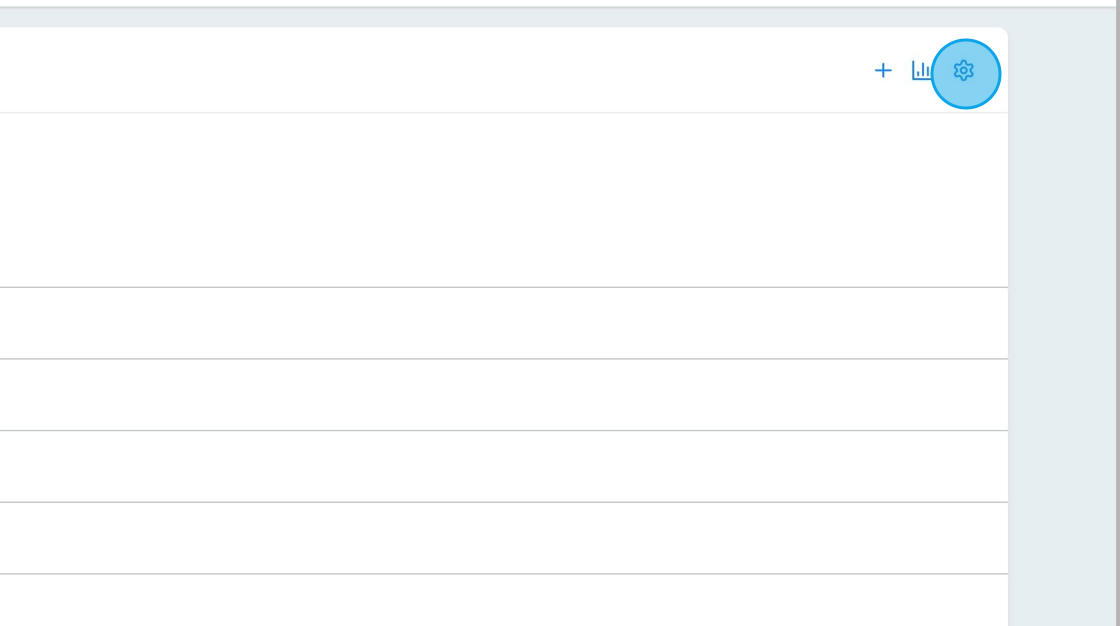
5. Configuration is the same for web & app. Start by configuring your Vitals list & BMI settings by clicking on the settings wheel in the top right corner of the screen. These settings will apply to all patients once configured.
6. Determine which vitals you want displayed, and then uncheck any you don't want, and hit Save.
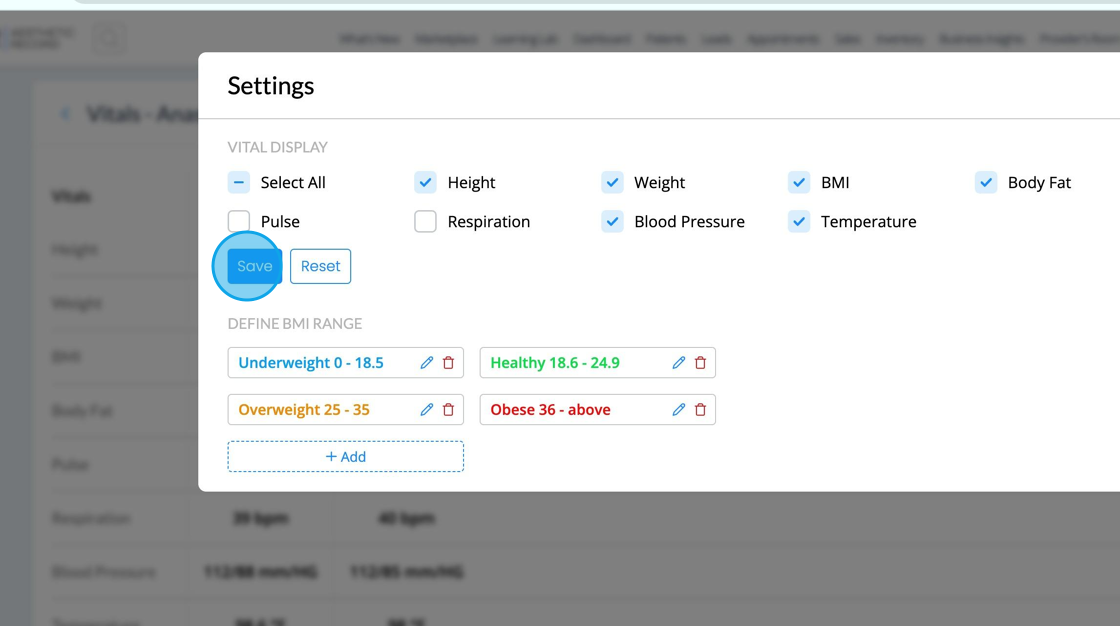
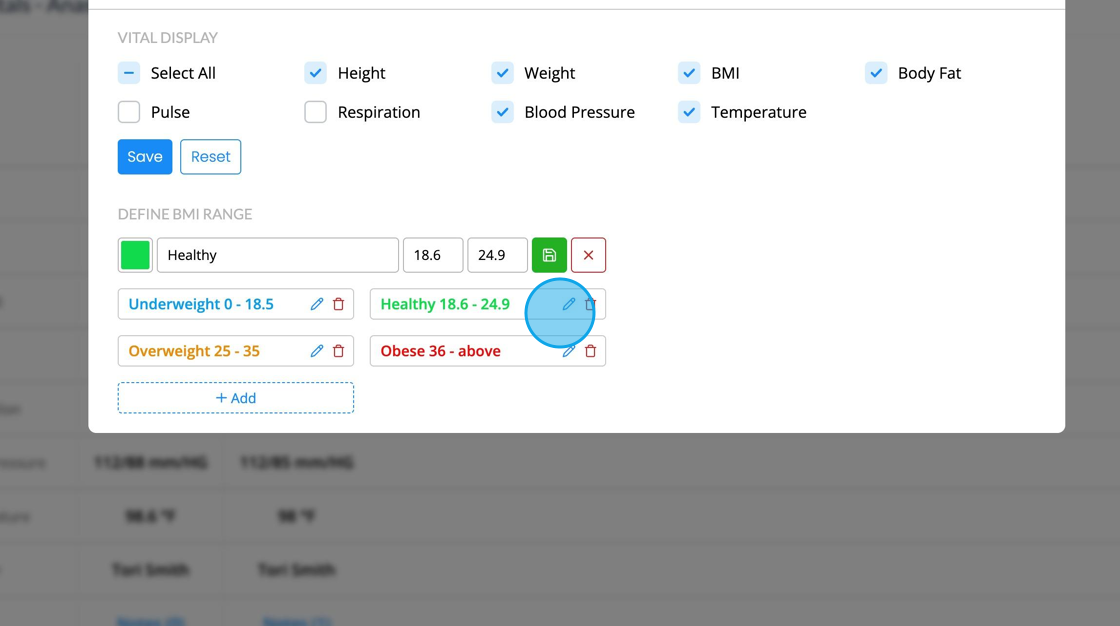
7. We've predefined standard BMI ranges for you, however, you can change them to reflect what you consider to be the appropriate range for those listed. You can also rename them and change the color scheme. Just click the edit pencil. Don't forget to hit the green save icon when you finish.
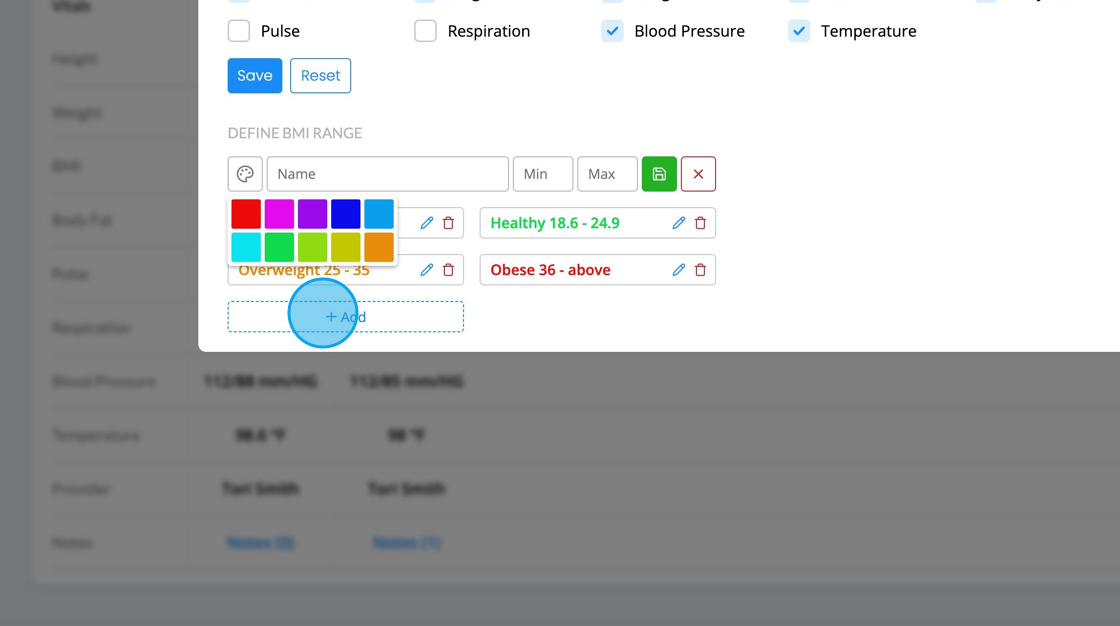
8. If you prefer to add a new category, click +Add, and then define the color, name and range, and hit Save.
Record Vitals for a Patient
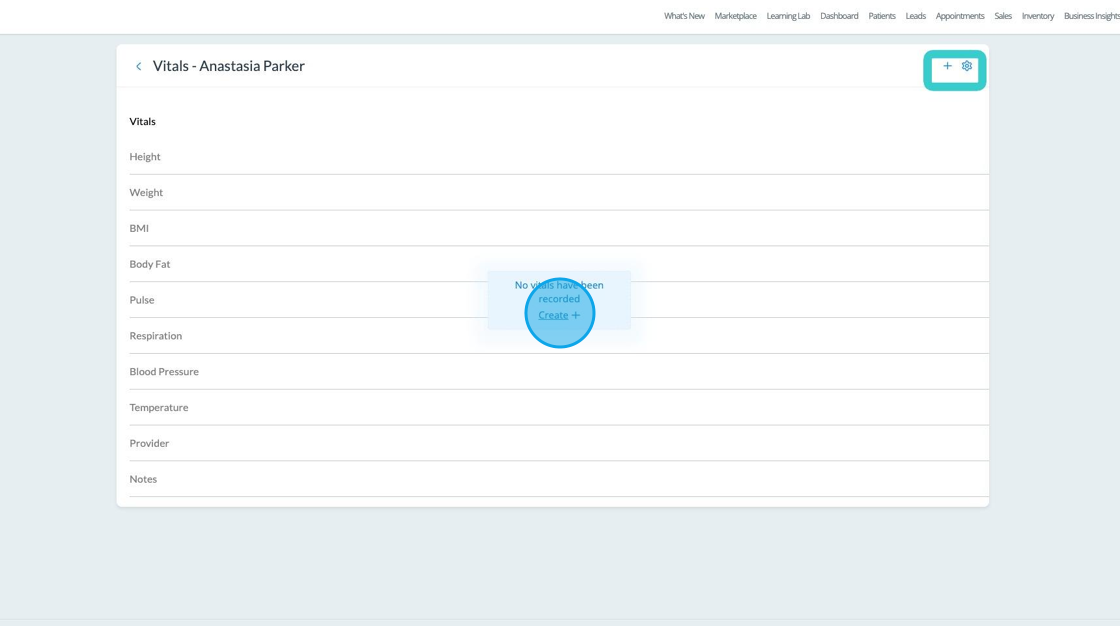
9. Web: Exit out of the Settings menu, and get ready to chart your vitals! If this is the first time to chart vitals for this Patient, click the Create option in the middle. If you are returning to chart additional vitals, click the + button in the top right hand corner.
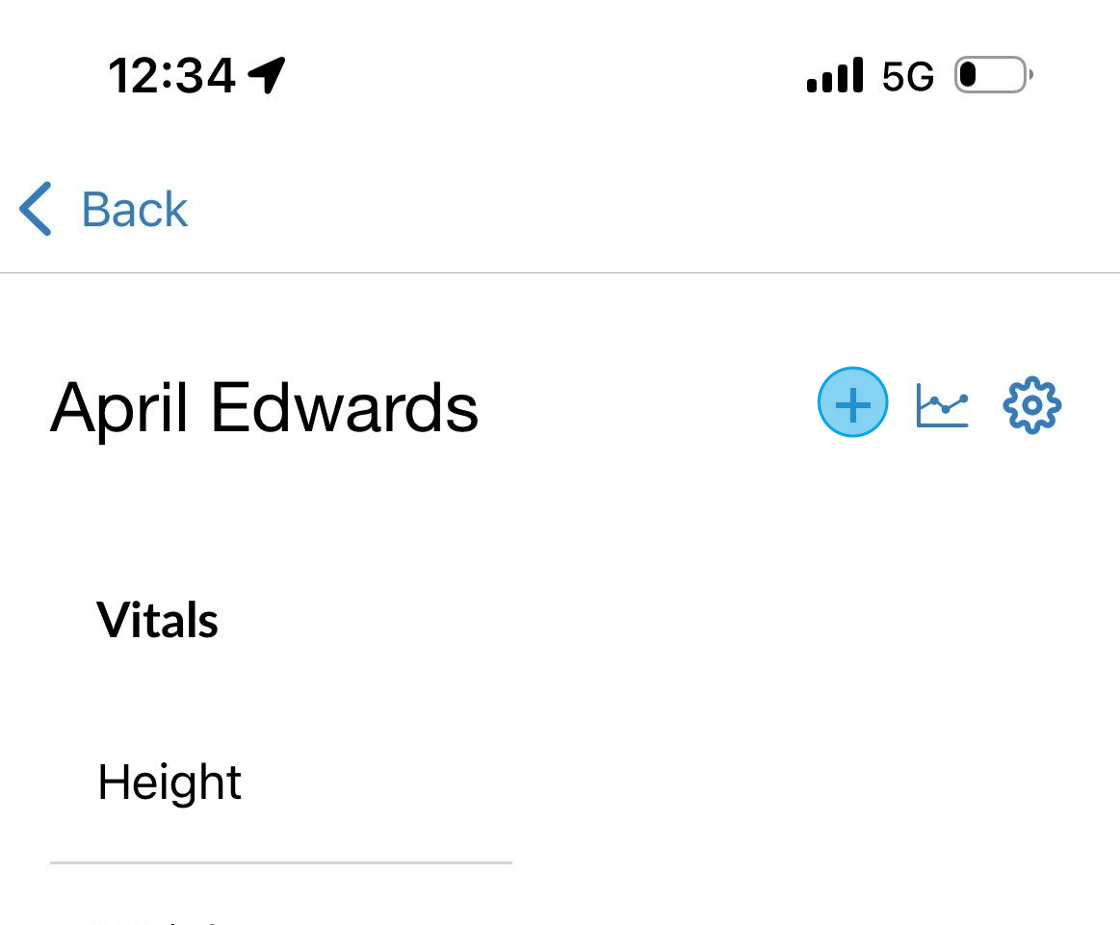
10. iPad App: Click on the Vitals area again, and locate the plus sign on the top right corner to begin recording a new set of vitals.
11. iPhone App: Click on the + button as if you were going to create a new procedure, and select Vitals
12. iPhone App: Click the + button in the top right hand corner
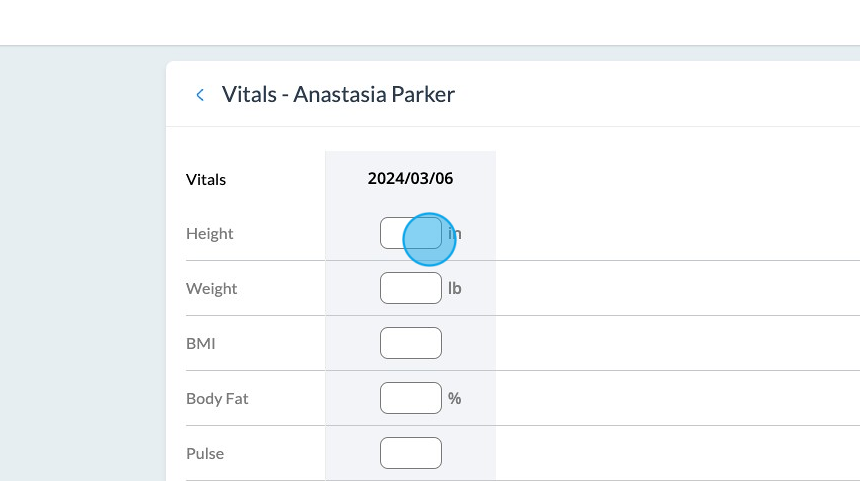
13. Begin recording the Patient's vitals. Please note, you can change your unit of measurement for inches / centimeters, pounds / kilograms and fahrenheit / celsius under Settings > Business Information.
For height, you will need to record as total inches or total centimeters.
14. For BMI, once you record the measurement and hit Save, you will see it show up i the color range that you created in Settings.
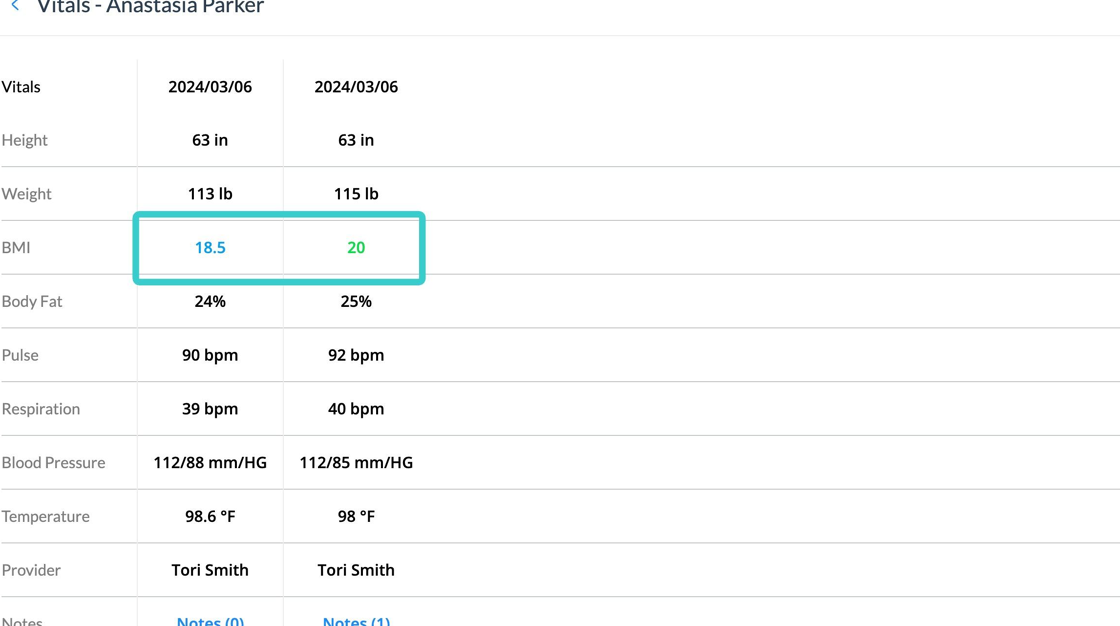
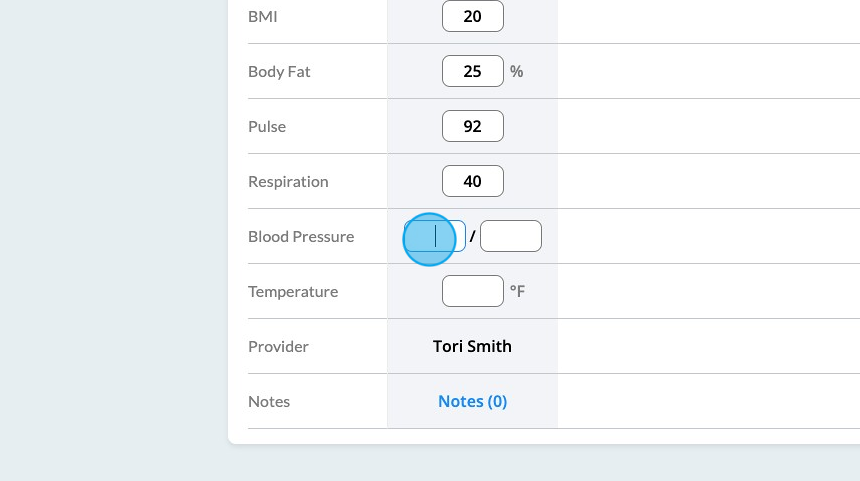
15. When entering blood pressure, it is broken up in to systolic & diastolic, so be sure to record it that way.
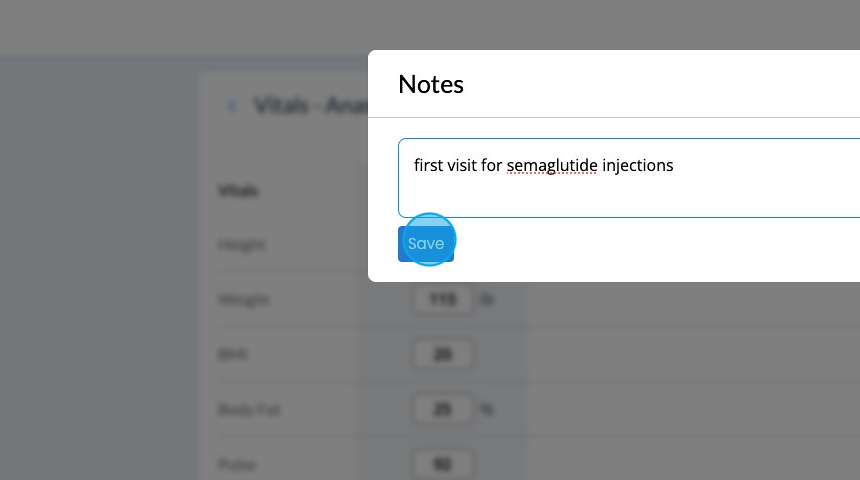
16. If you'd like to add a note to your entry, click on Notes, enter it, and click Save.
17. Once you complete your entry, do not forget to click the save icon in the top right had corner!!!
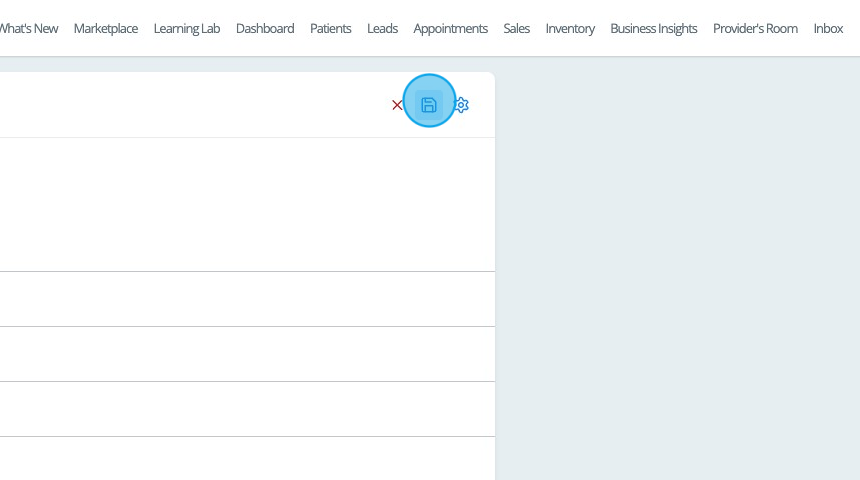
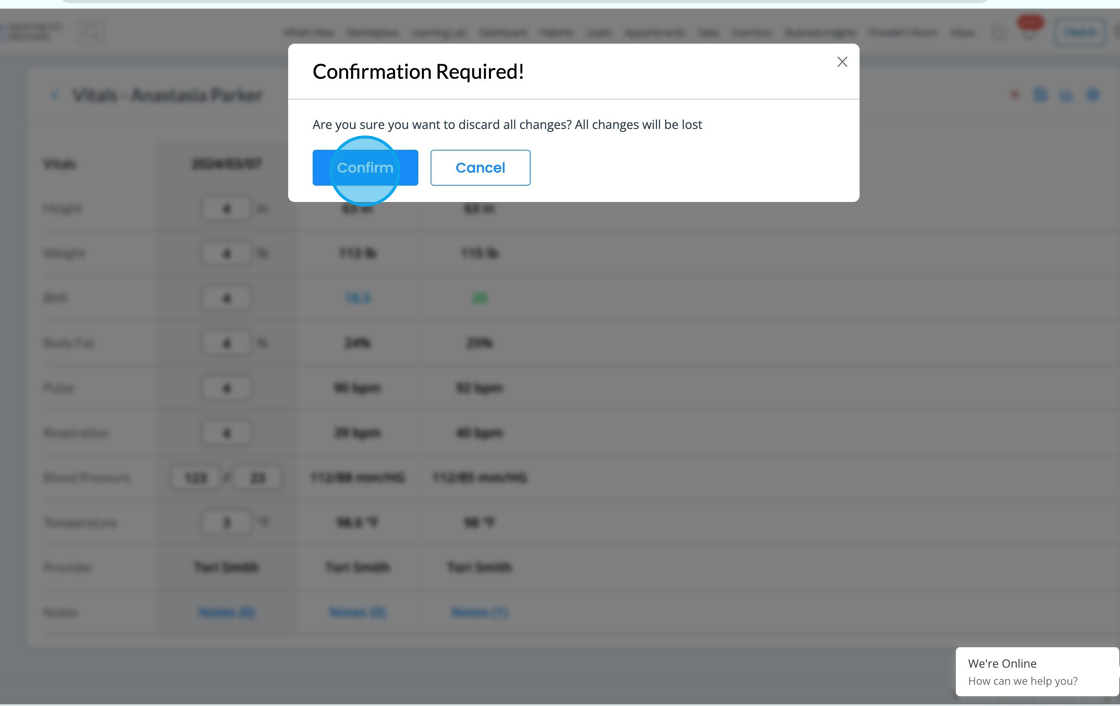
18. If you'd like to discard your changes instead, click the red X and confirm the action.
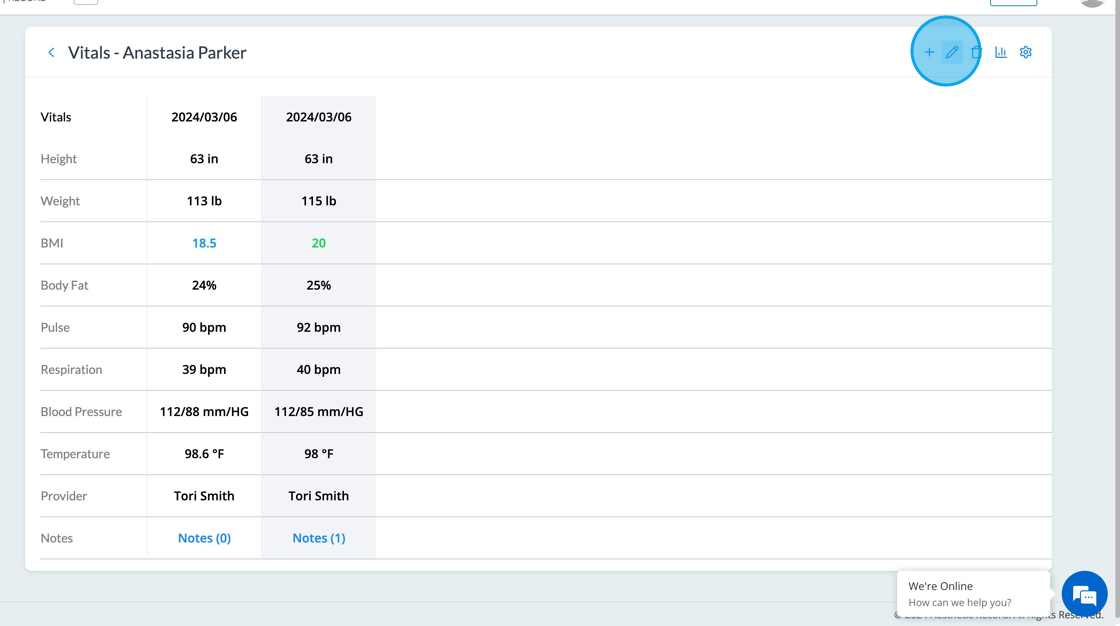
19. Once you have saved records, you can go back and edit them. First, click on the record you want to amend, then click the pencil button. The fields will unlock so you can make changes. Once you're done, don't forget to click the save icon.
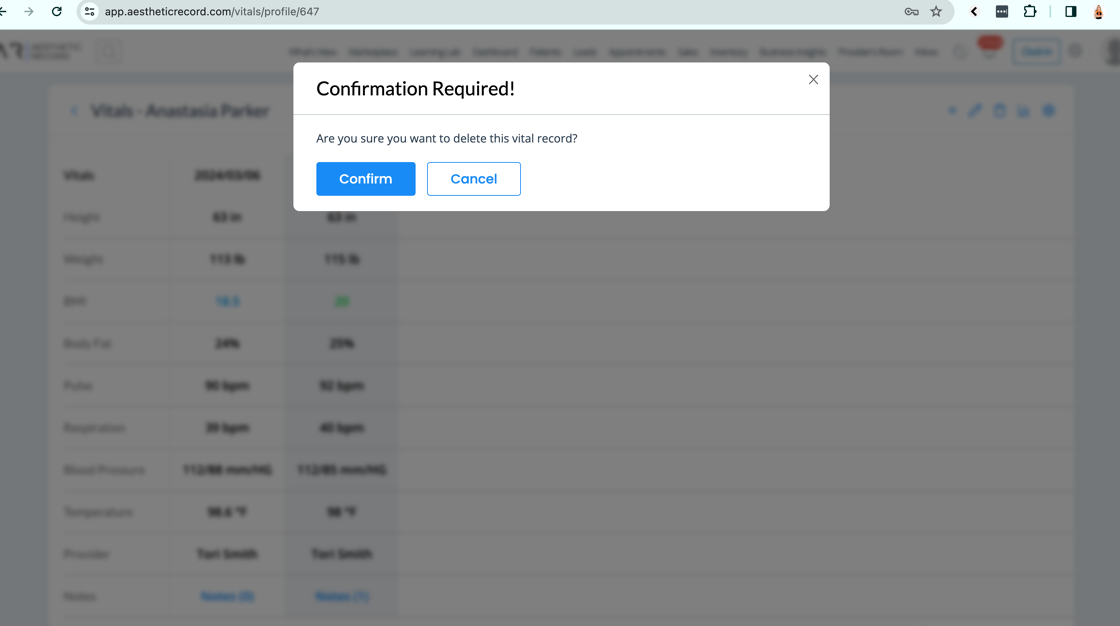
20. To delete a vitals record, click on the entry you want to delete, and then clic the trash icon. Confirm the dialogue box to complete the action. Please note, once it's deleted, it's unable to be restored!
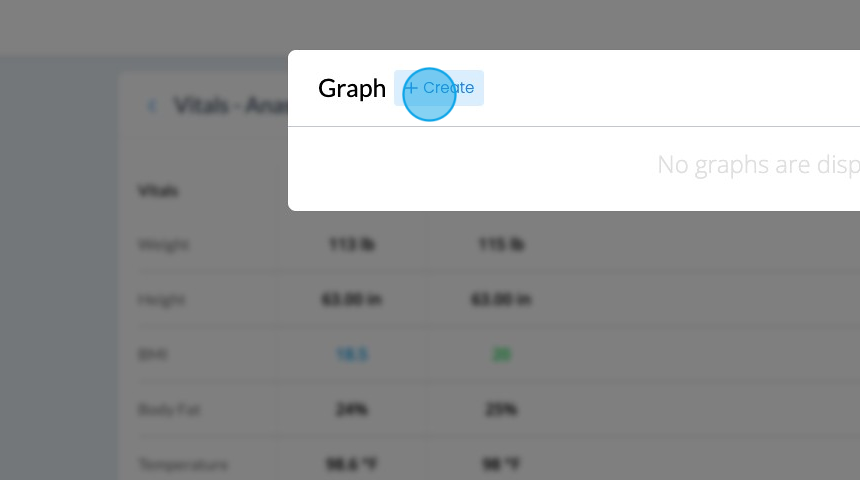
Create Progress Graphs: Web & App
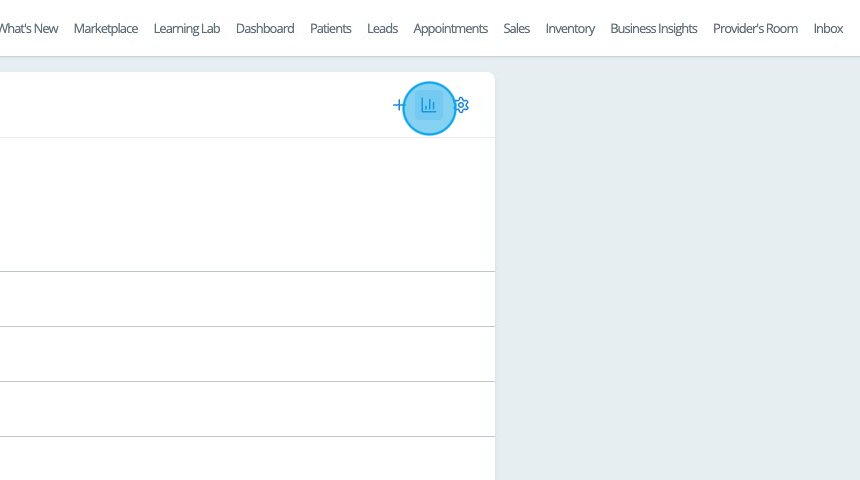
21. You can create a timeline graph for any vital measurement as long as you have at least 2 visits to compare. To start, click on the graph icon in the top right hand corner.
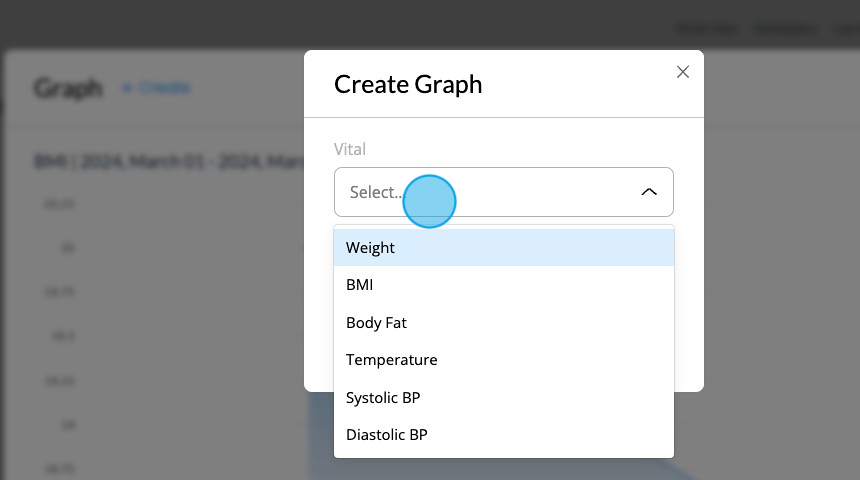
22. Click Create
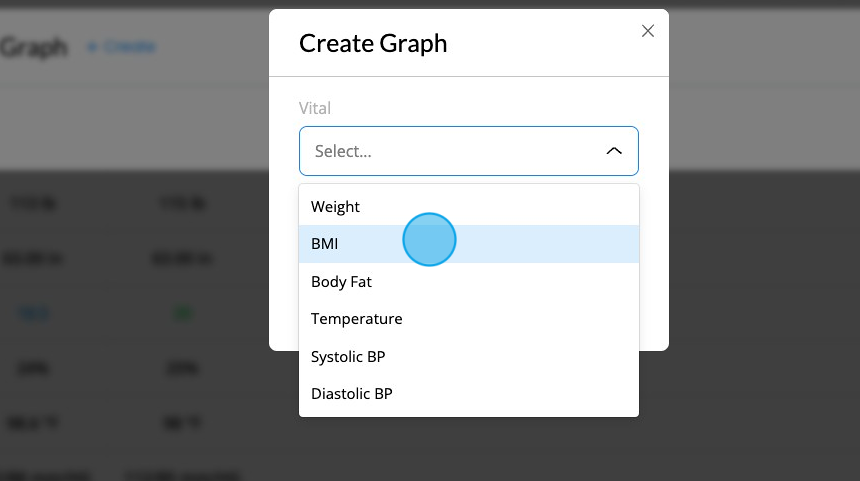
23. Choose which measurement you want to use for your graph.
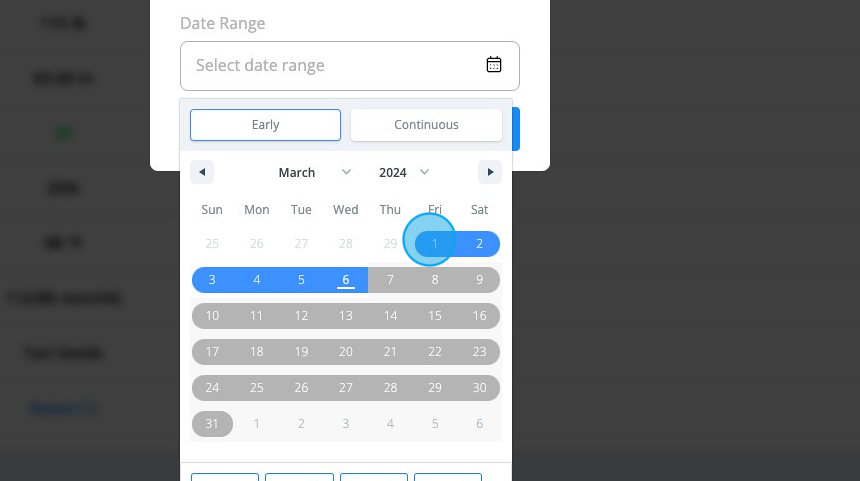
24. Select the time frame for which you'd like to measure changes.
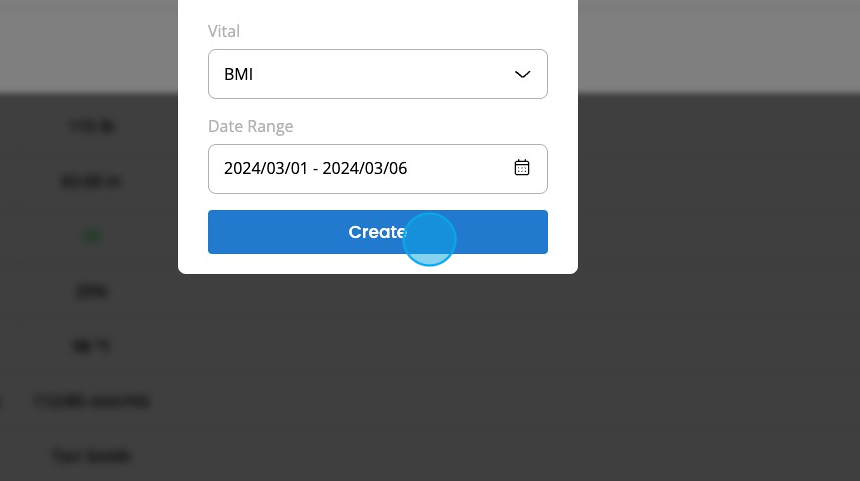
25. Click Create
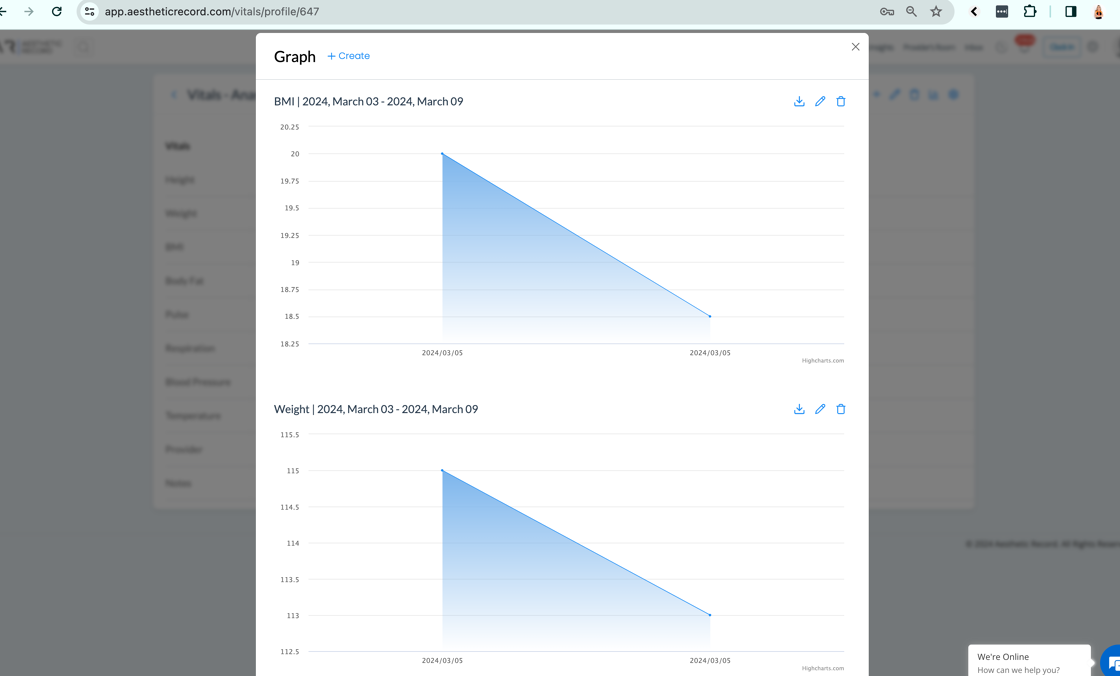
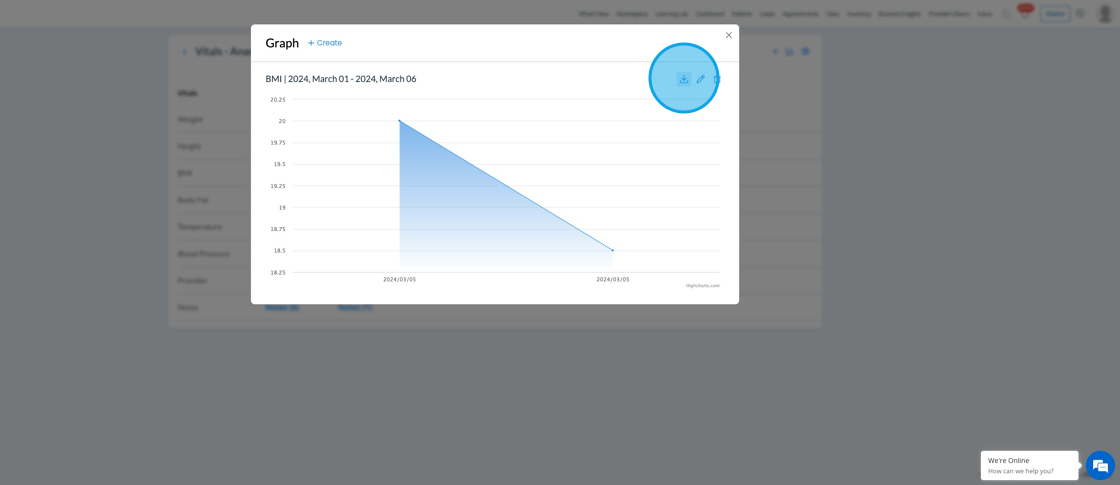
26. Your graph will now appear. You can export it by clicking on the download icon, edit that same graph via the pencil icon, or delete with the trash icon.
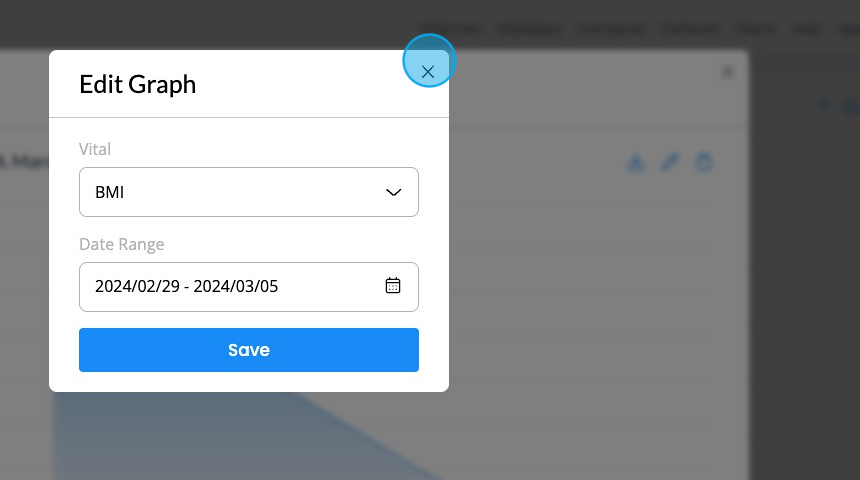
27. When you click the edit icon, you can change the vital or the date. Remember, that it's only changing it for that existing graph- it will not create a new one with a different vital. You will need to create a second graph for that.
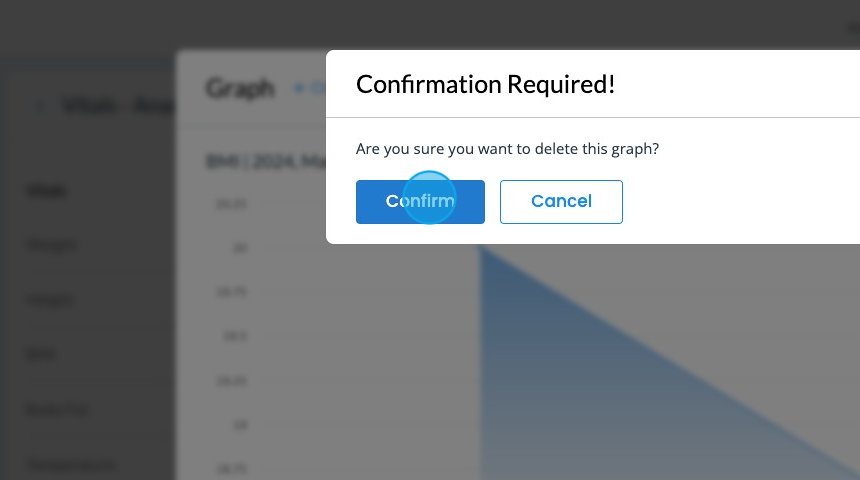
28. If you choose to delete a graph, click to confirm.
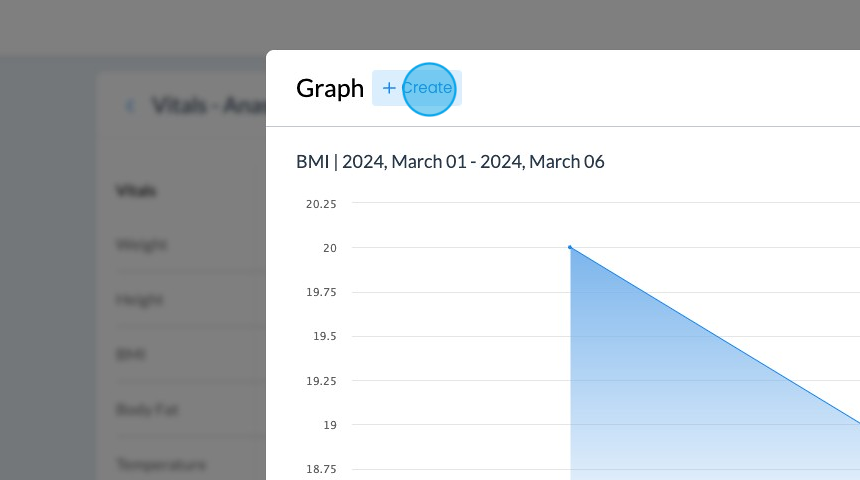
29. To add more graphs, click Create.
30. Once again, make your selections and click Create.
31. As you add more and more graphs, they will be listed in a row. Please note, once you leave the Patient's vitals area, these graphs are not saved. You will need to create them again if needed.